Databox Alternative
Looking for an option to Databox then difdash is the alternative
What makes difdash the best choice
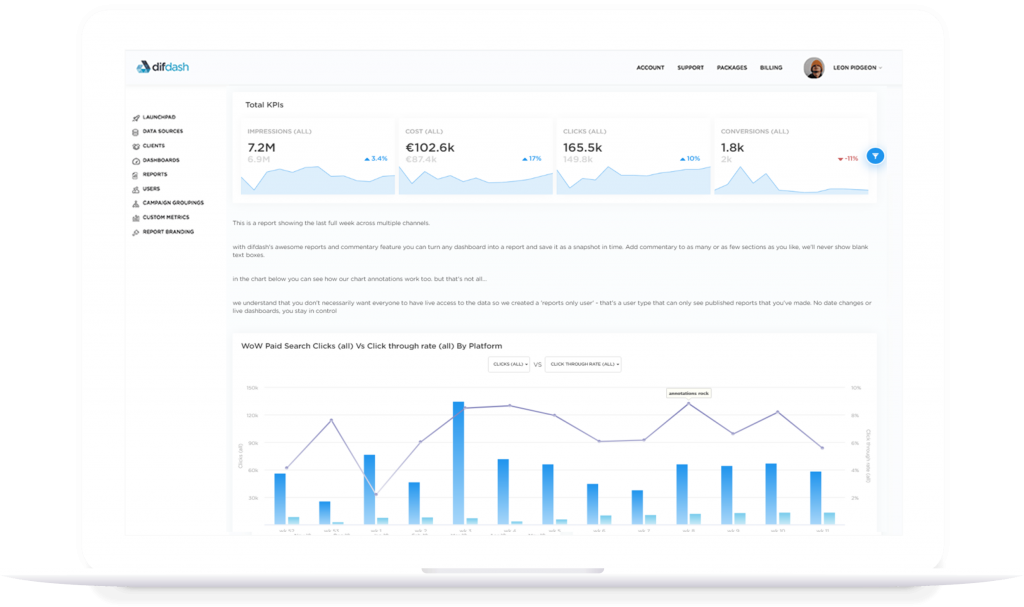
Easily create dashboards with charts, tables, maps and more; using any metric, from multiple sources, to ensure you see exactly what you need

Connect all your data sources in 30 seconds with no need to pay third parties or create complicated files

dashboard builder
Create complex dashboards with filtered data from multiple sources without any code

archive
Never lose a report again! Once your report is made, it's available online, forever, in your report archive

export
One click to export your dashboard into a ready-made presentation for your next team meeting

chart annotations
Turn your dashboard into a report. Add detailed commentary with images and links or just annotate charts so your clients get more than a dashboard

exports
Whether you need raw data from all your data sources in a file, or a beautifully designed PDF dashboard to share in a meeting, our exports have what you need

data sources
Upload your own data via our custom data source tool. Once set up, you can email the file to a dedicated address every day and it'll be included in your dashboards. Easy!

a metric
Need to include your fees in cost? Have your own formula for ROI? Create them in seconds using our powerful create a metric tool. No code required

segmentation
Want to see brand only performance? Use our simple campaign grouping feature to segment your campaigns and use them to power charts and dashboards without writing a line of code

delivery
Need a weekly report sent? No problem, once you've created your dashboard, schedule it to be emailed every week on whatever day you want, without lifting a finger

users
Knowledge is power, everyone in your organisation can benefit from the knowledge in difdash. We don't you to think twice before adding everyone, so we don't charge for users on any paid packages

saving
Once set up, your dashboards update every morning. No more downloading reports, refreshing pivot tables or dragging formulas; just beautiful dashboards ready to be viewed on any device

conversion
Got some global clients but need to report in one currency? Use our default exchange rates or upload your own and we'll apply them every morning while importing your data

errors
Reduce the chances of human error by relying on our expert written code to import your data and perform calculations. Our systems don't take days off so every dashboard is correct, every time

themes
We think our branding is pretty sweet but we know you might need a different colour scheme to suit your brand so we created a range of themes for you to choose from and easily apply

clients
No more emails chasing reports or issues when a new team member joins. No more delays on new additions to reports. And with all the time you'll be saving, there'll be even more to show off!
Data from all your platforms in one place


See how much better our reports look
Click below to see an example of a weekly report with commentary

How it works
1
Connect your data sources
difdash and start your journey towards the perfect dashboard
2
Create your dashboard
Our intuitive dashboard builder will guide you through the process to reach your perfect dashboard. A great selection of charts, maps and visualisations will ensure your dashboard looks great and offers real insight. Once you’ve mastered the perfect dashboard, use it for other clients to save time


3
Share with colleagues and clients
All our paid packages come with unlimited users because we want your whole team to have quick and easy access to your most important data. Create reports and presentations from your dashboards with commentary and chart annotations to make sure nothing is missed
Start Free Trial
Let us walk you through all the features in a short demo

